Tutorials
Variability plots - ZAR1 case study
This tutorial will focus on ZAR1 – an ancient NLR shared by most flowering plants – to illustrate how NLRscape variability plots could be used to analyze a given protein.
In 2019, the cryo-EM structures of ZAR1 were reported in three stages of the activation mechanisms: resting ADP-binding, activated with absent nucleotide and activated ATP-binding state in pentameric conformation. The experimental structures were instrumental in understanding how sequence-structural traits interplay during activation (Wang et al 2019 a,b).
In this tutorial we will initially analyze solely the variability plots and next confront our observations with the cryo-EM structures.
ZAR1 clusters
The sequence view page of ZAR1 from arabidopsis, contains a series of already precomputed clusters, but also custom clusters can be generated. Custom clusters are in general recommended when investigating the homology family centered around a given sequence of interest, whereas the precomputed clusters are generated based on the overall NLR landscape density. Therefore, in precomputed clusters, the sequence of interest could have a more marginal position, with potential homologs not covered by the cluster span.
For this tutorial we will use 2 clusters:
- Cluster with more distant homologs (clustered at 30% identity)- cluster view page
- Cluster with closer homologs (clustered at 50% identity) - cluster view page
The variability plots of both 50% and 30% clusters are shown below. Variability is expressed as relative entropy with the degree of conservation proportional to the letter height (Find out more about variability plots)
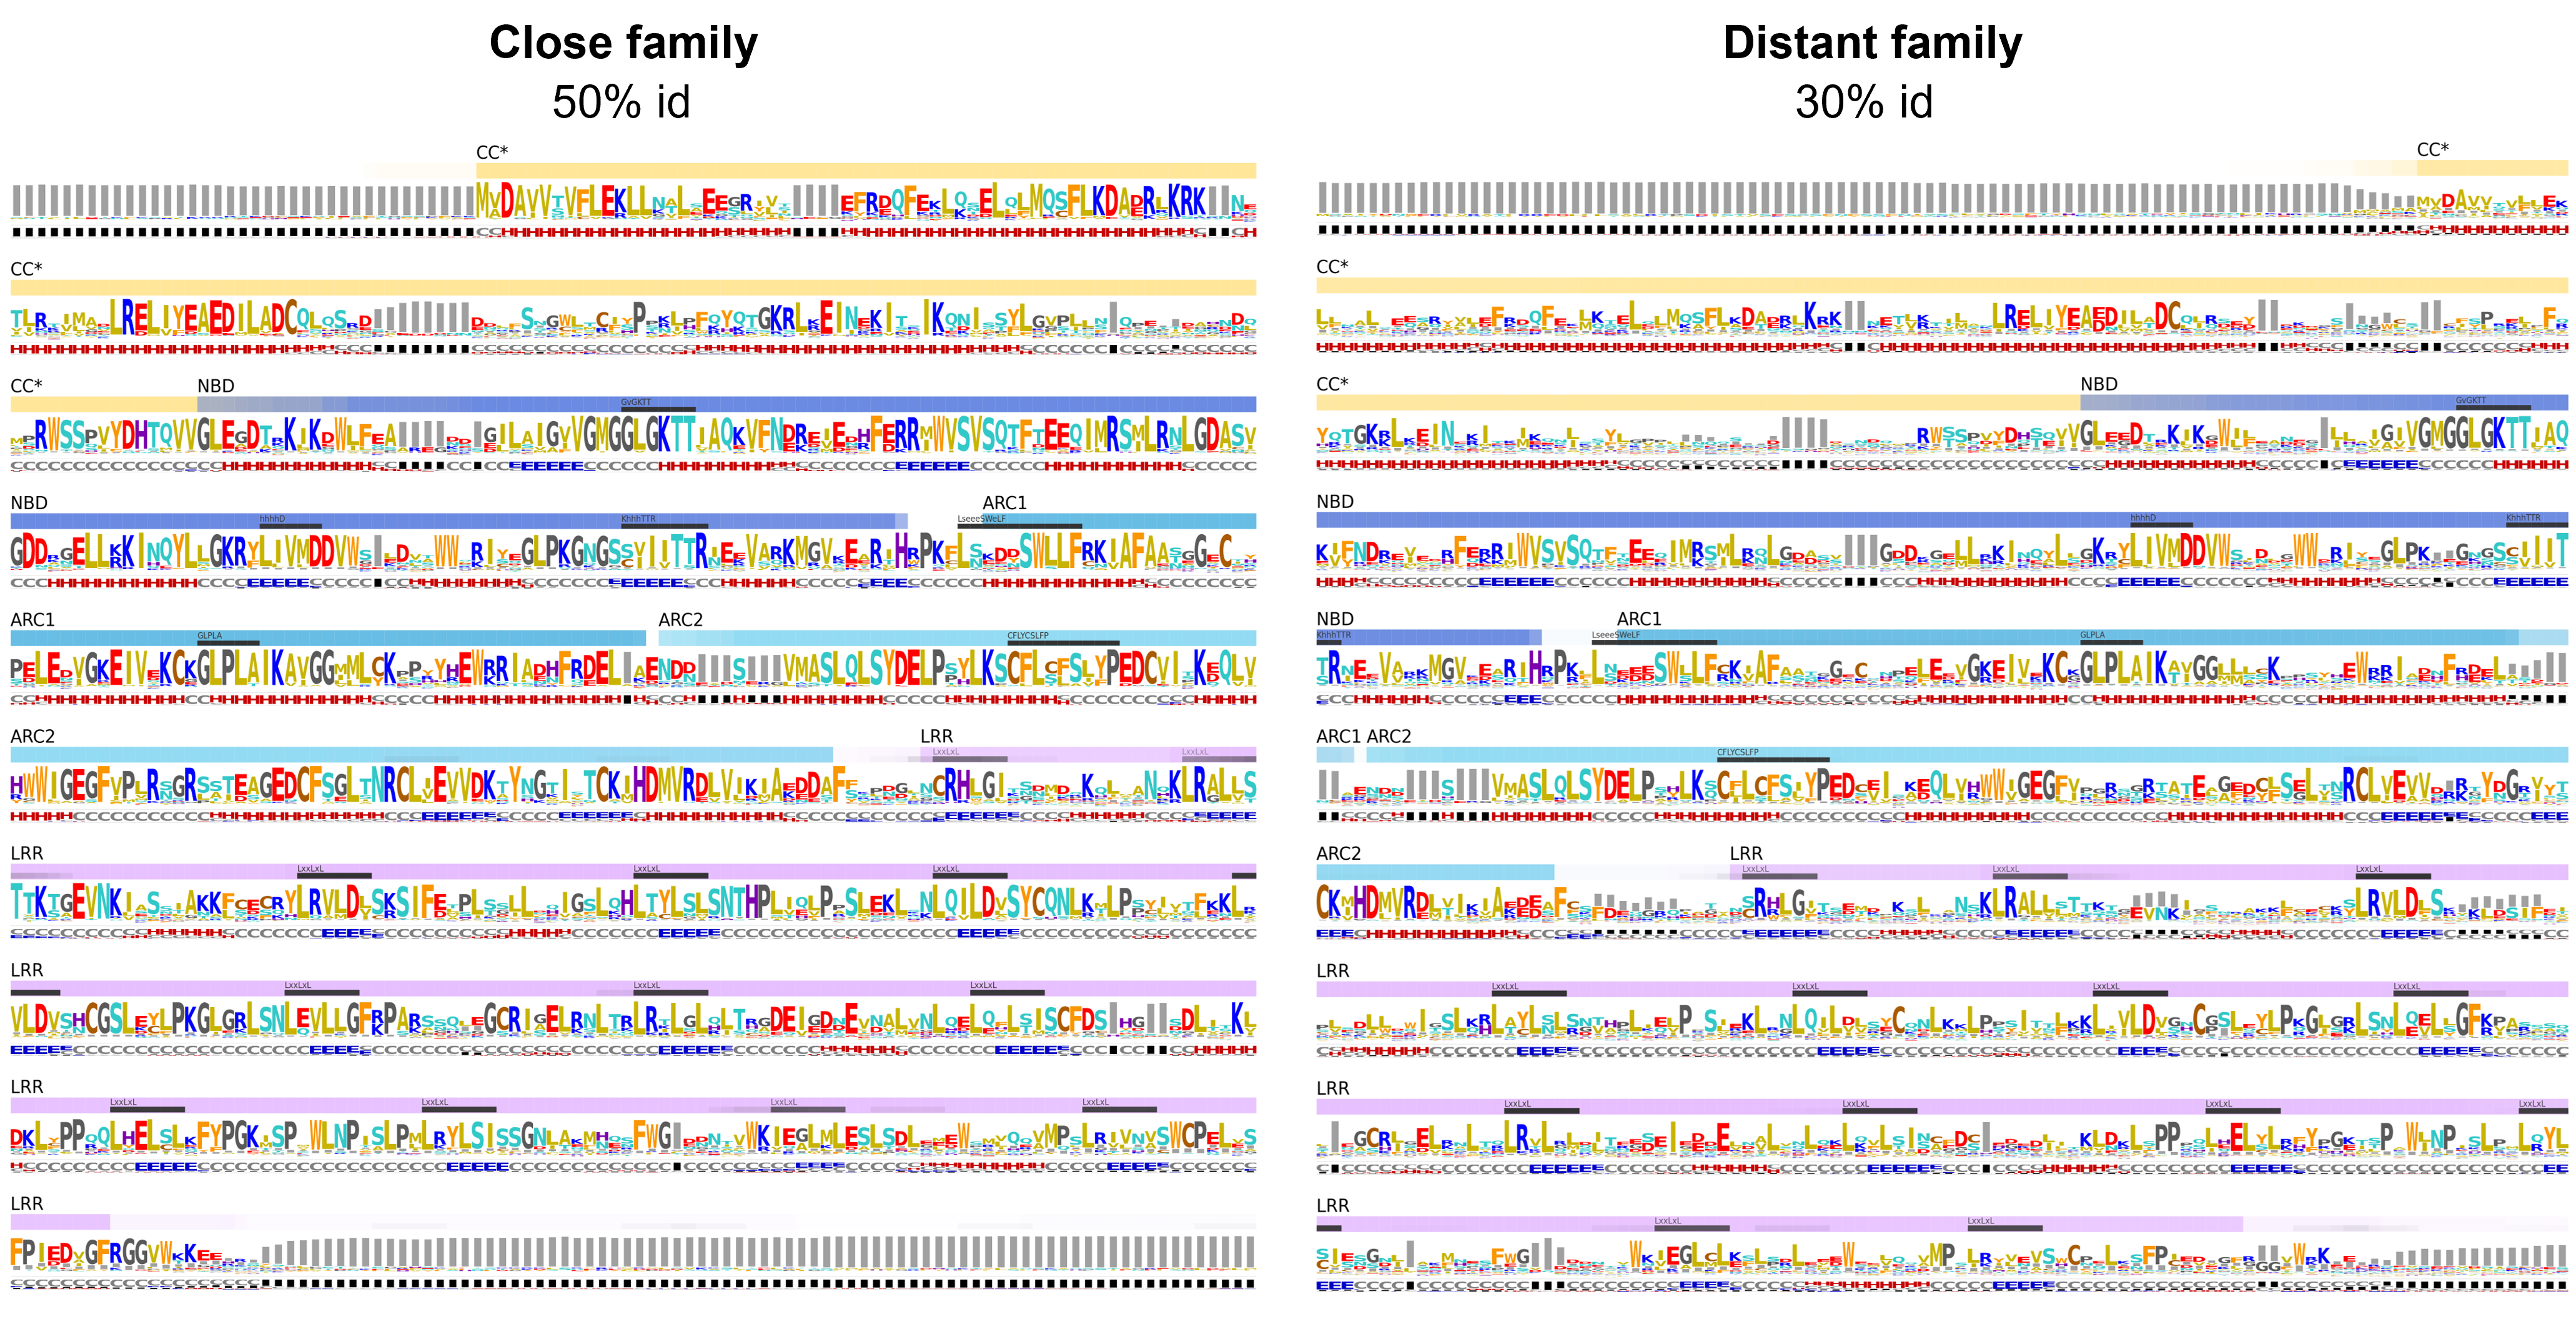
The CC domain
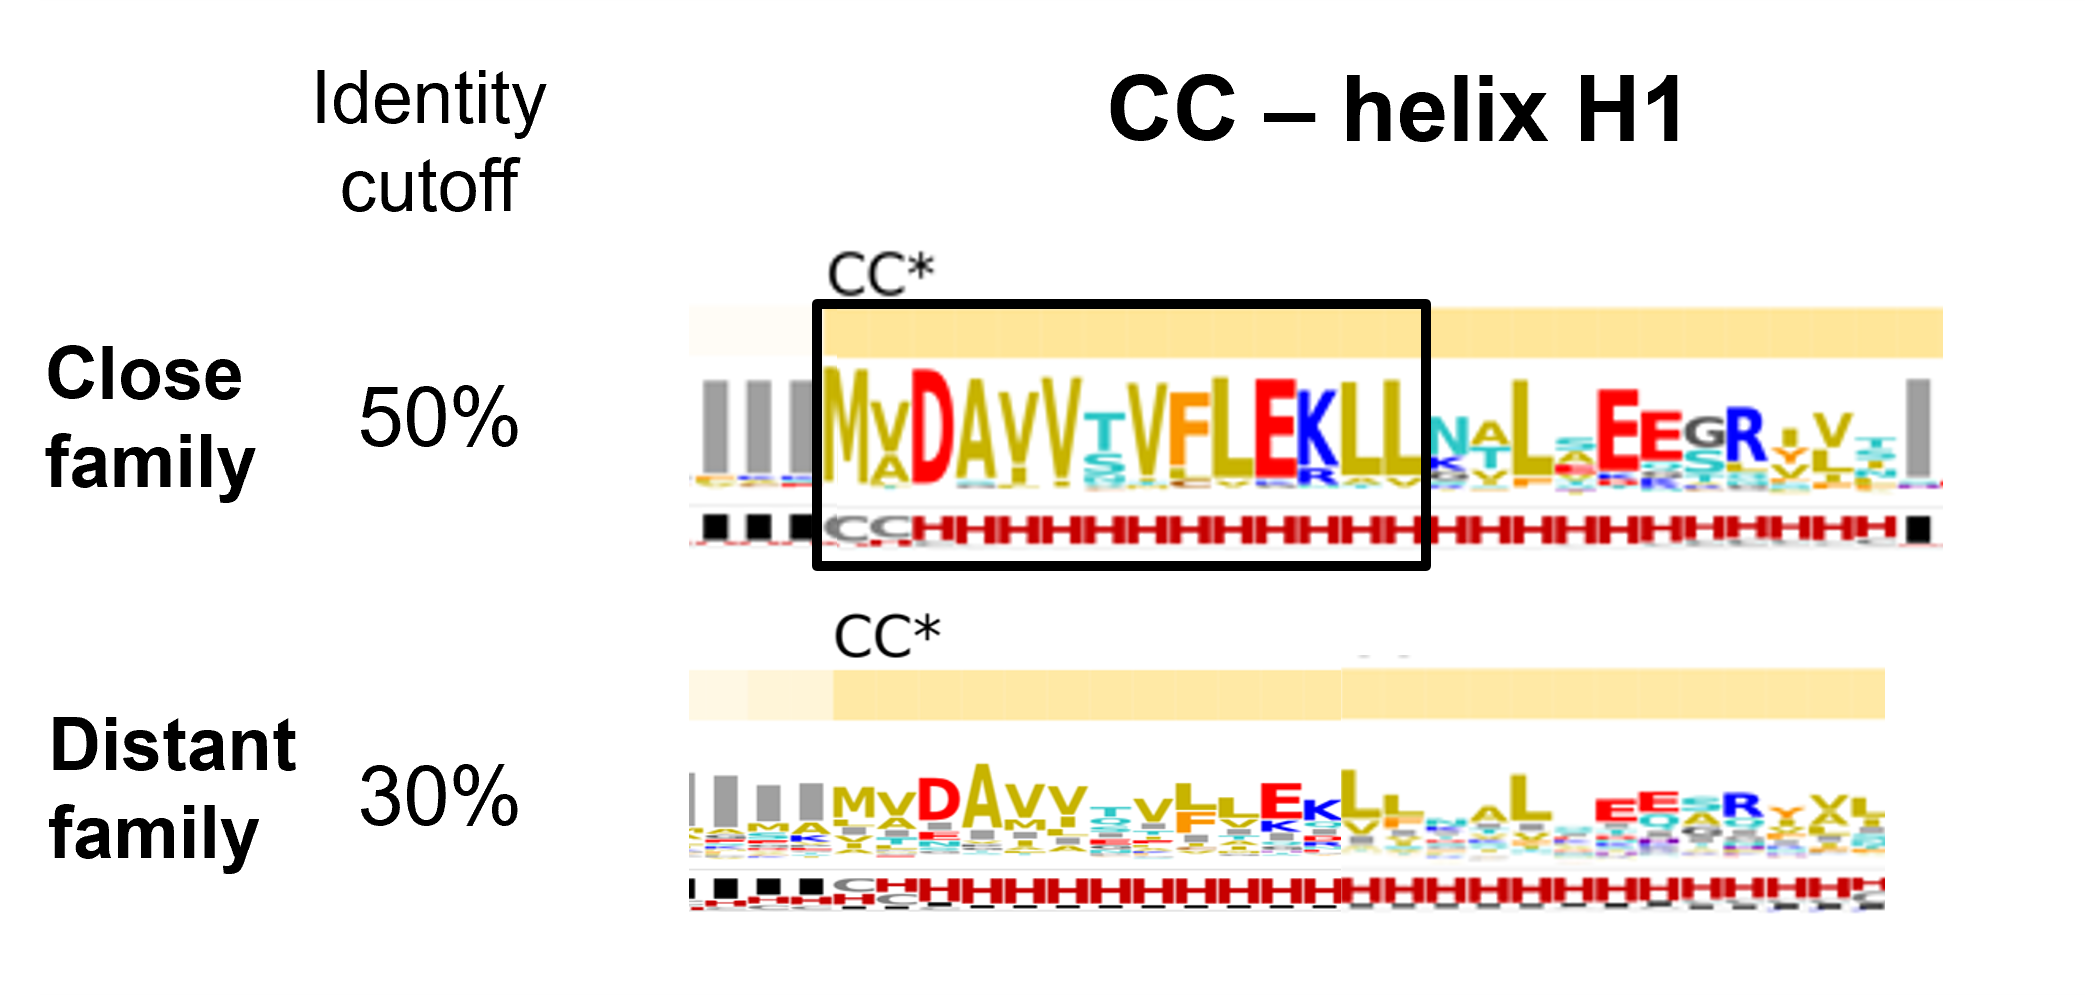
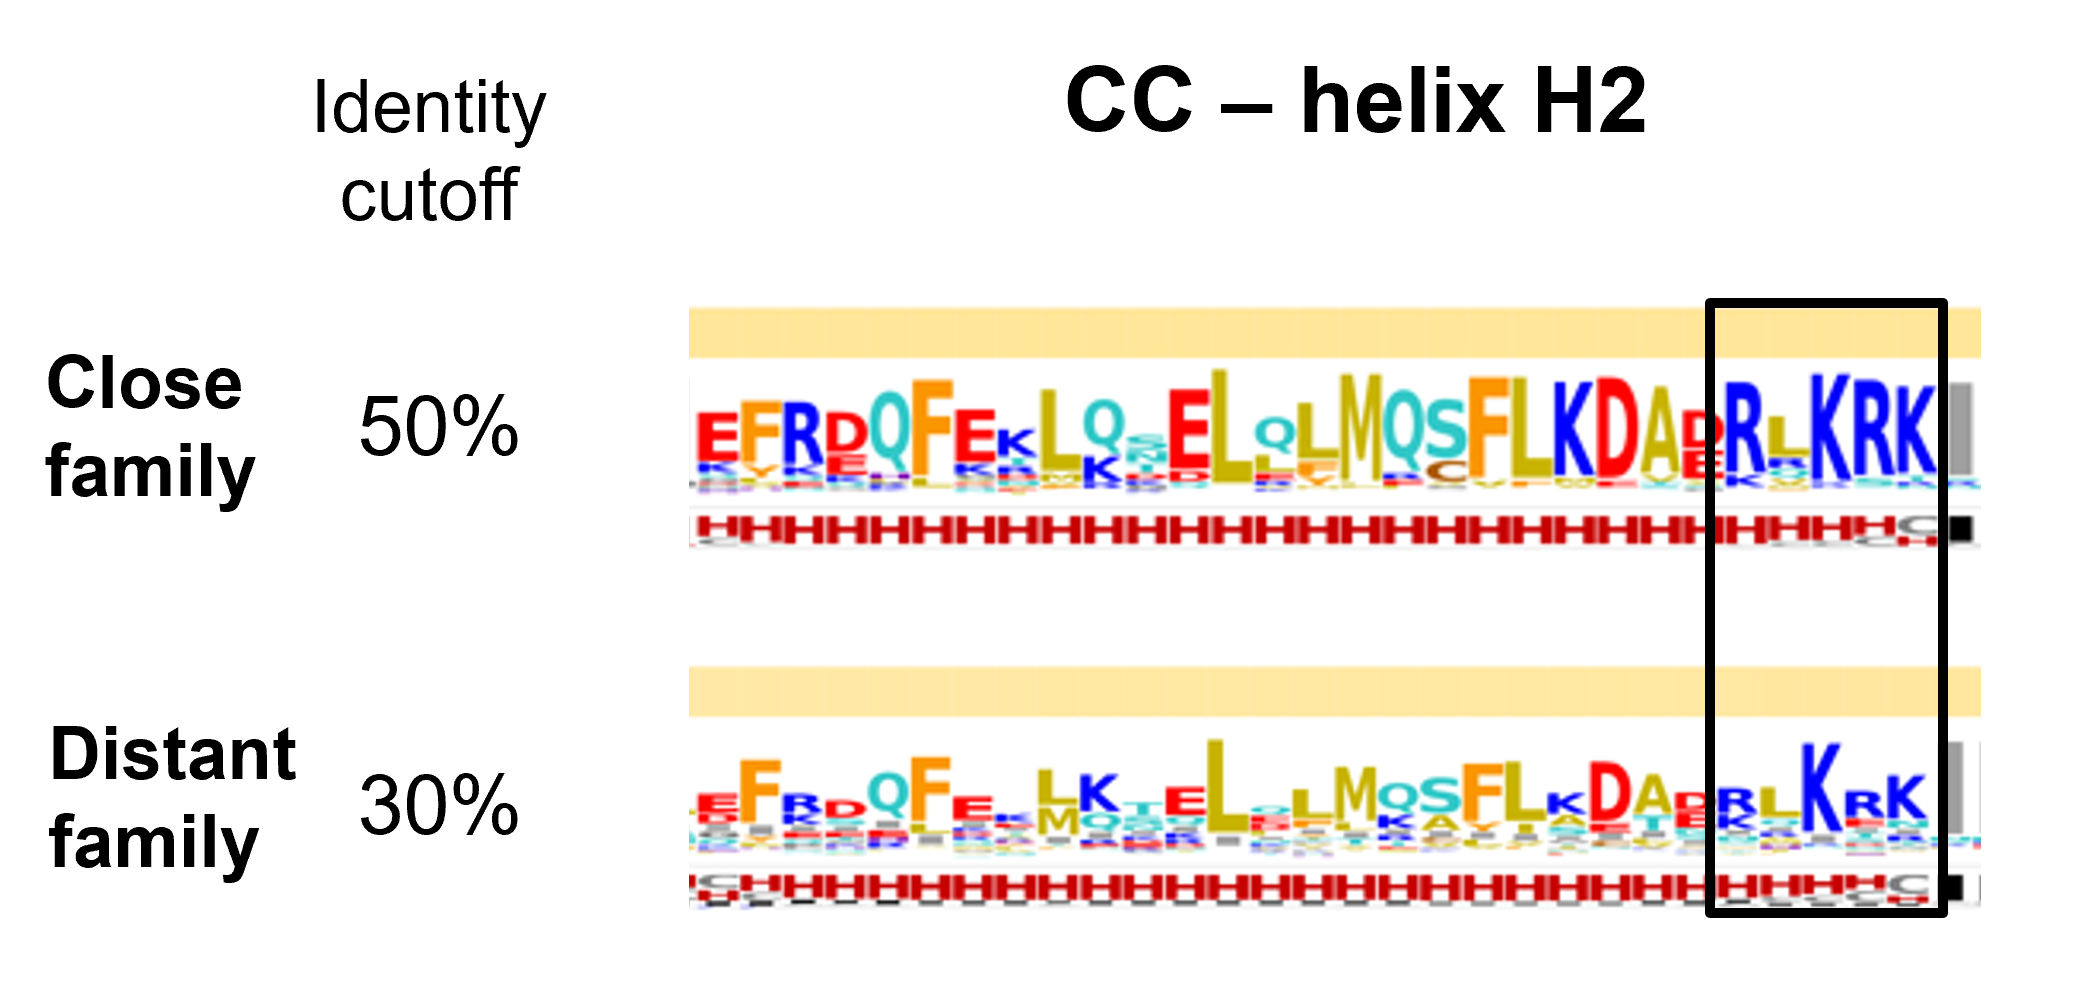
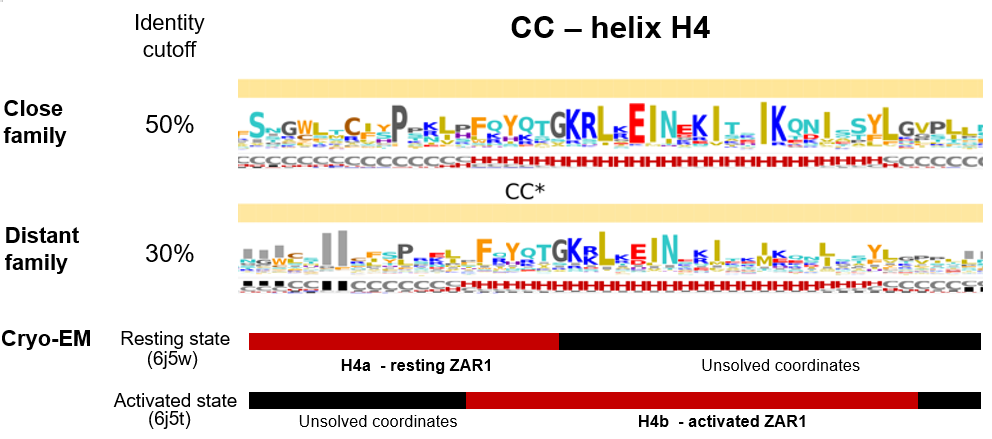
At a quick glance, analyzing the variability of both sets within the CC domain, we notice four regions with high helical propensities. On all four helical segments an alternate hydrophobic-hydrophilic pattern is present suggesting that each helical segment has a solvent exposed side and a solvent burried face, which is consistent with the helical bundle architecture as depicted by the ZAR1 cryo-EM.
Helix H1
Helix H2
Helix H3

Helix H4
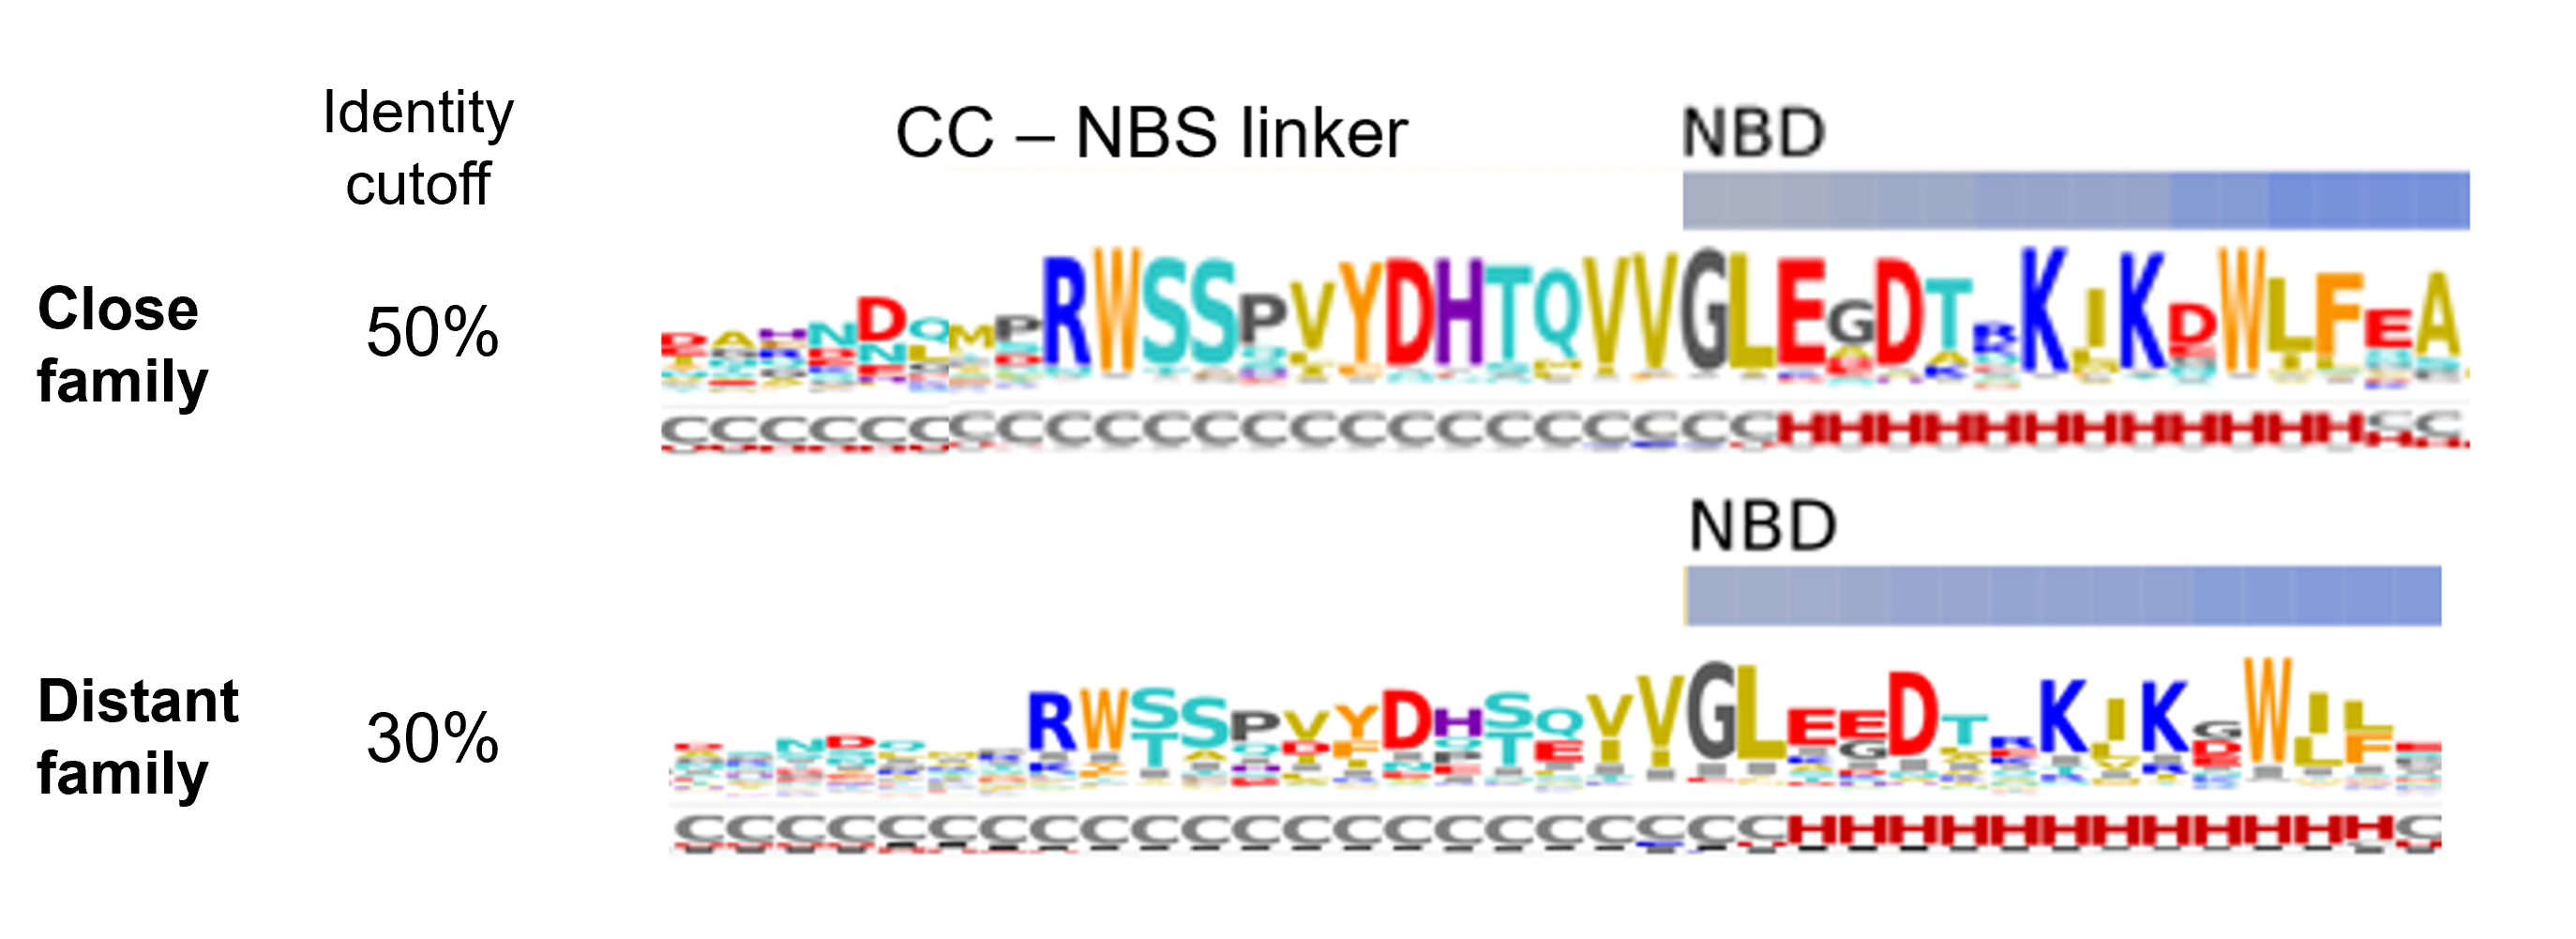
The CC-NBS linker
The LRR domain
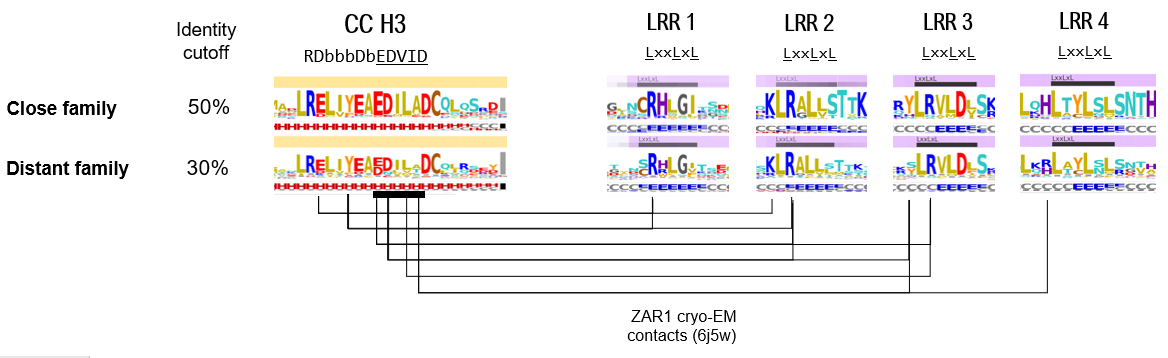
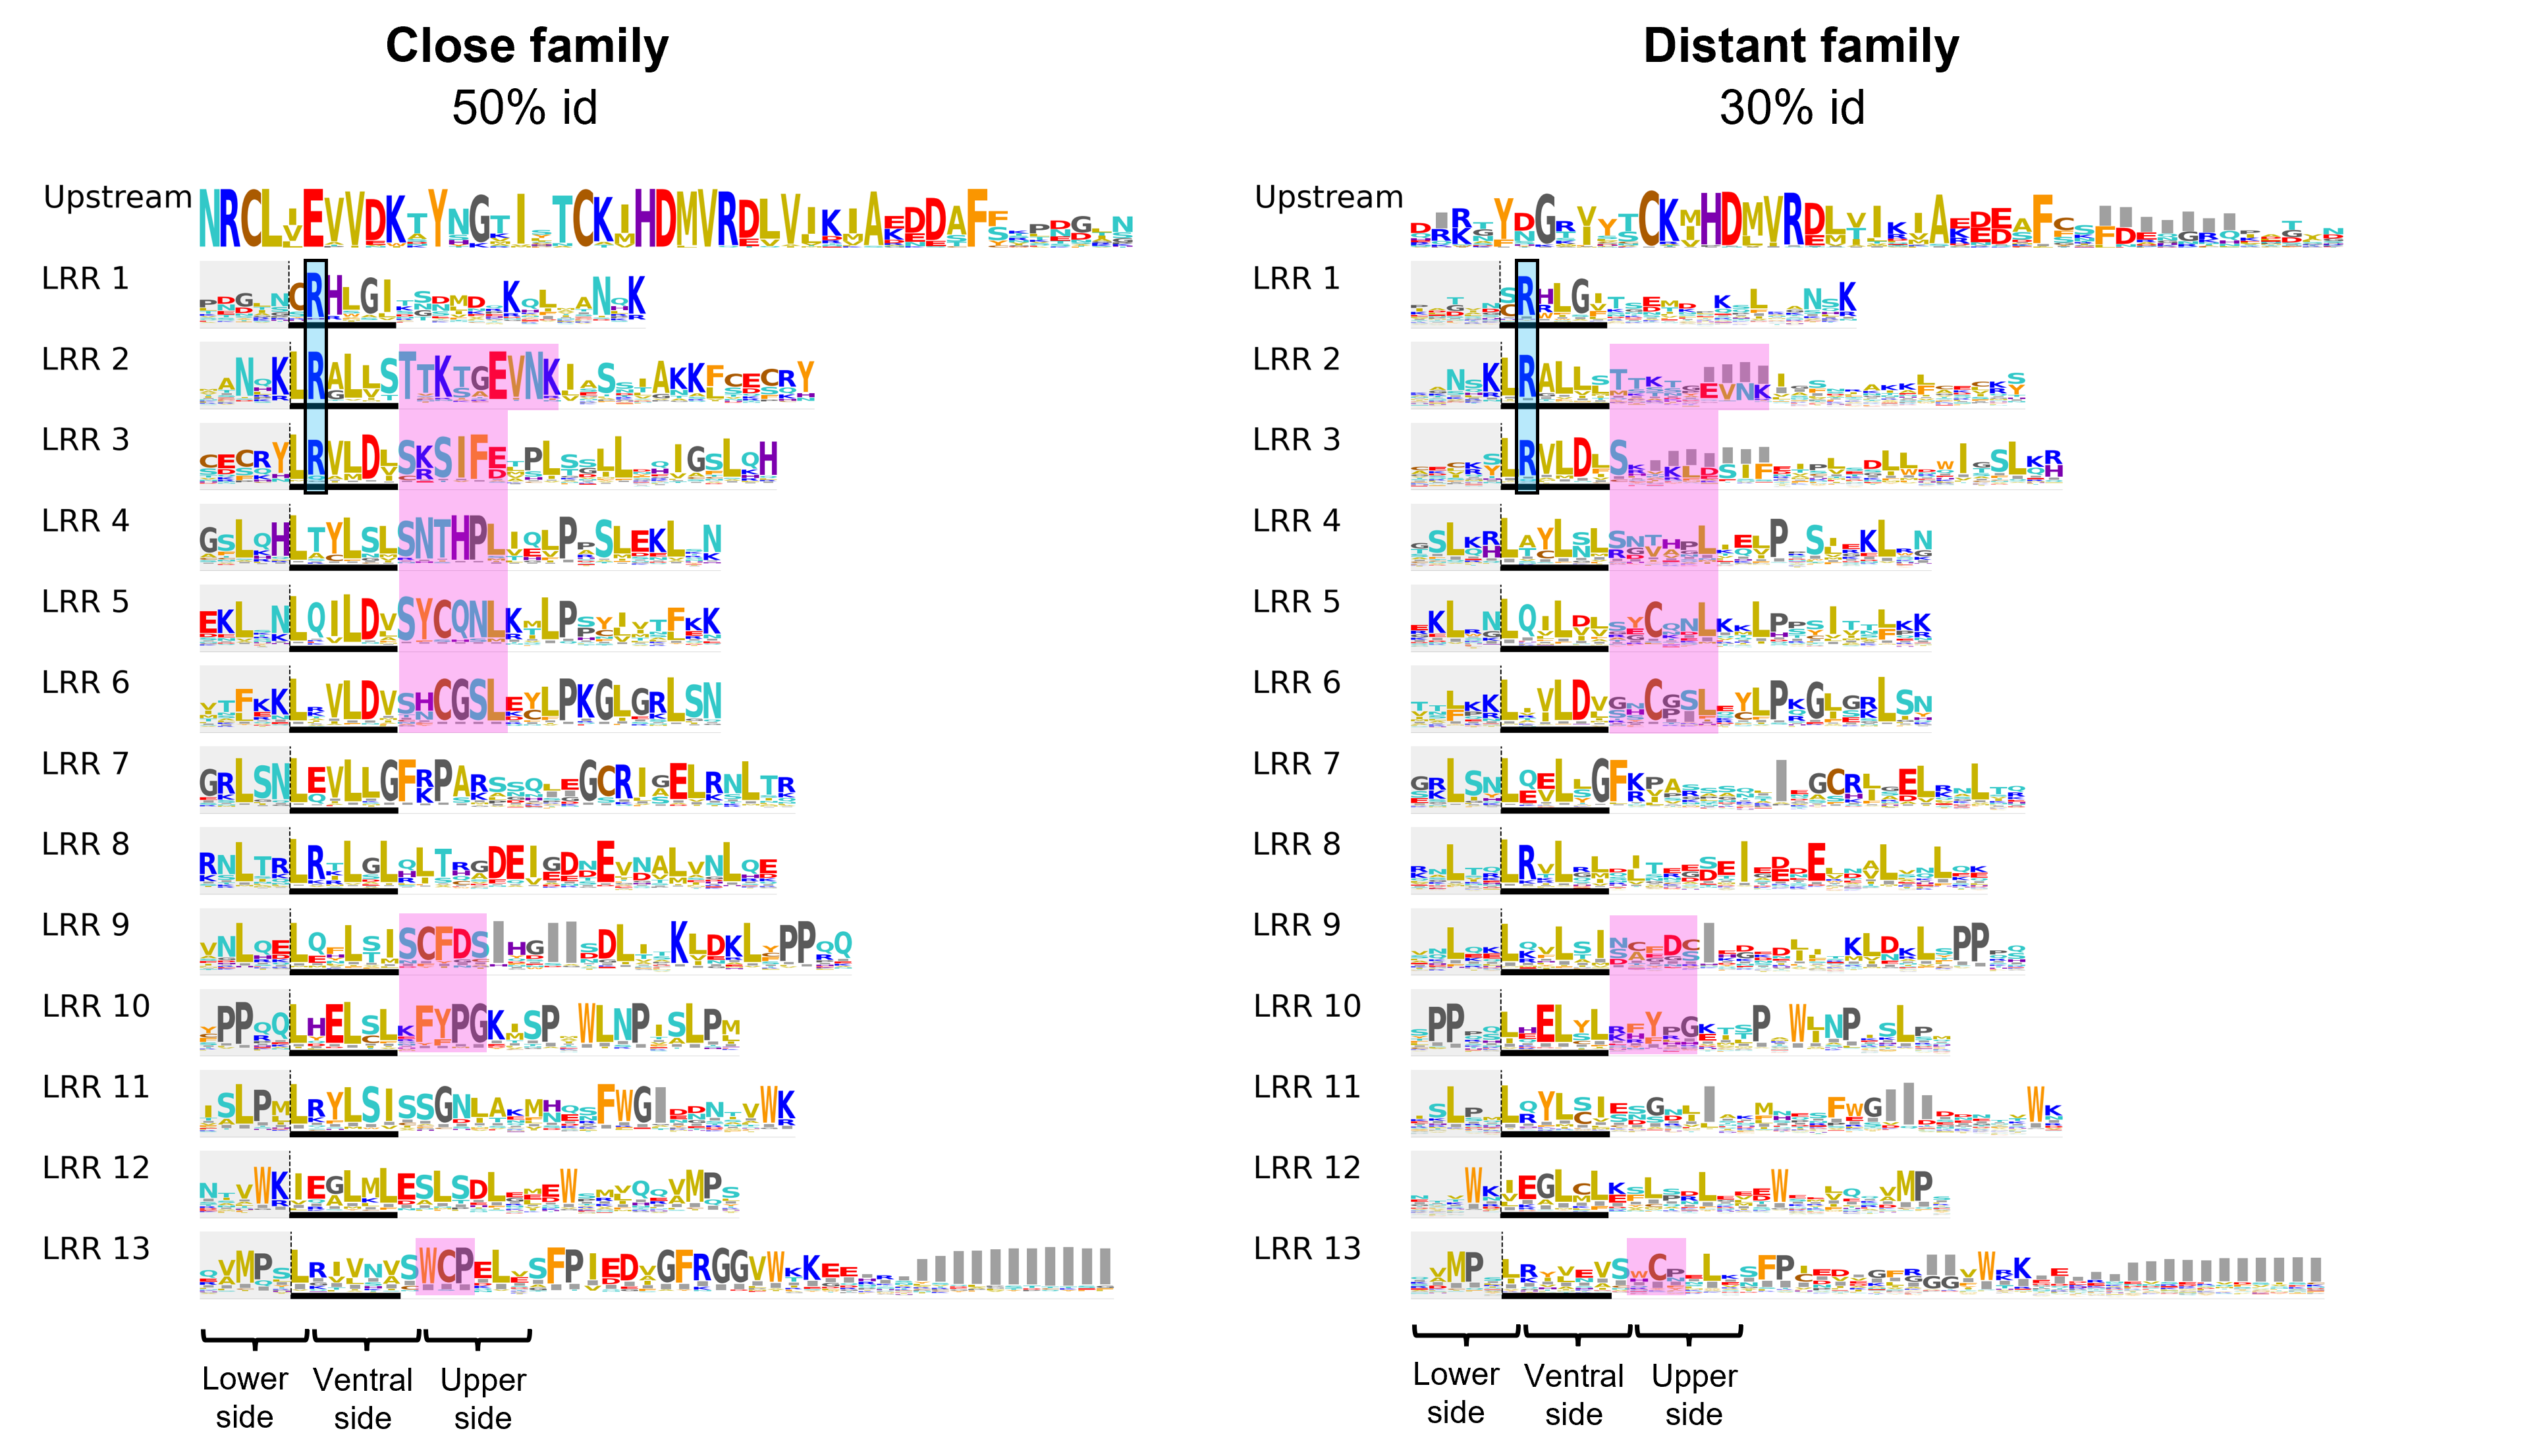
For LRR domain analysis, provided is a 2D plot showing the LRR repeats arranged one below the other similarly to their 3D arrangement. This layout facilitates the visualisation of the relationships between residues located on consecutive LRR repeats, but in close proximity in the 3D space
The positively charged (basic) patch discussed above, is in contact with the an acidic patch on the CC domain, located on the third helical segment surrounding the EDVID motif. Both close and distant homologs set display this conserved regions on the CC and LRR domains (depicted with blue boxes in figure below), suggesting that even more remote homologs of ZAR1 might share a similar interaction profile between the CC and LRR domains.
References
Wang J, Wang J, Hu M, Wu S, Qi J, Wang G, Han Z, Qi Y, Gao N, Wang HW, Zhou JM, Chai J. Ligand-triggered allosteric ADP release primes a plant NLR complex. Science. 2019 Apr 5;364(6435):eaav5868. doi: 10.1126/science.aav5868. PMID: 30948526.
Wang J, Hu M, Wang J, Qi J, Han Z, Wang G, Qi Y, Wang HW, Zhou JM, Chai J. Reconstitution and structure of a plant NLR resistosome conferring immunity. Science. 2019 Apr 5;364(6435):eaav5870. doi: 10.1126/science.aav5870. PMID: 30948527.